
I spent the day creating Data Talks. It includes tons of forms for documentation, as well as, question stems and so much more. I wanted to make sure this is a big help to principals, instructional leaders and academic coaches. All pages included have little color or simply black/white for ease on the color ink budget.
Take a look:
Included in this packet- Student Intervention Tracking Form, Data Teams Vertical, Data Teams Horizontal, Data Talk Documentation Tool: Reflect, Commit and Plan, Data Debrief Calendar template and Data Process template.
This new file is perfect for you PLC meetings too. A PLC is a process in which educators work together to achieve better results for the students they serve. Is your PLC becoming stagnant? If so, here is a great resource to revive the team. Data Talks helps you gather and document levels of student learning, develop strategies and ideas to build on the strengths and weaknesses of the students, implement strategies and ideas and so much more.
Check out these Data Talk Forms. I created two formats for you.
I love this next activity. Chart It! Step-by-Step directions on how to create a chart. Teachers chart their analysis strips using a T-chart format.
Teacher Classroom Data Analysis Planning Sheet and Data Goal Tickets included too.
Here’s a picture of a data goal ticket I created for you.
Are you looking for a way to keep student data organized? Create their very own RTI folder to house all the important documents and testing data. When you are preparing for a Student Intervention Team meeting, just grab the folder. Simply print and add your own data.
My favorite part of this are the question stems for data discussions. There are 48 cards with questions regarding student data. As you begin your data meetings, start off with question stems to get everyone thinking. Print these question stems on cardstock. Laminate and put on a metal ring. Choose a couple of them to begin conversations about the data. Option 2: Print several and display at different stations in your data room. Teachers answer the questions using the data displayed at that table. Teachers then share their findings with the group.

I’m Stephanie, and I’m the face behind Principal Principles. I’m a former principal turned educational consultant, presenter, and edupreneur. I’m obsessed with giving school leaders the tools they need to lead a successful school.

Hello friend! Welcome to Principal Principles. I’m Stephanie, and I’m the face behind Principal Principles. I’m a former principal turned educational consultant, presenter, and edupreneur. I’m obsessed with giving school leaders the tools they need to lead a successful school.

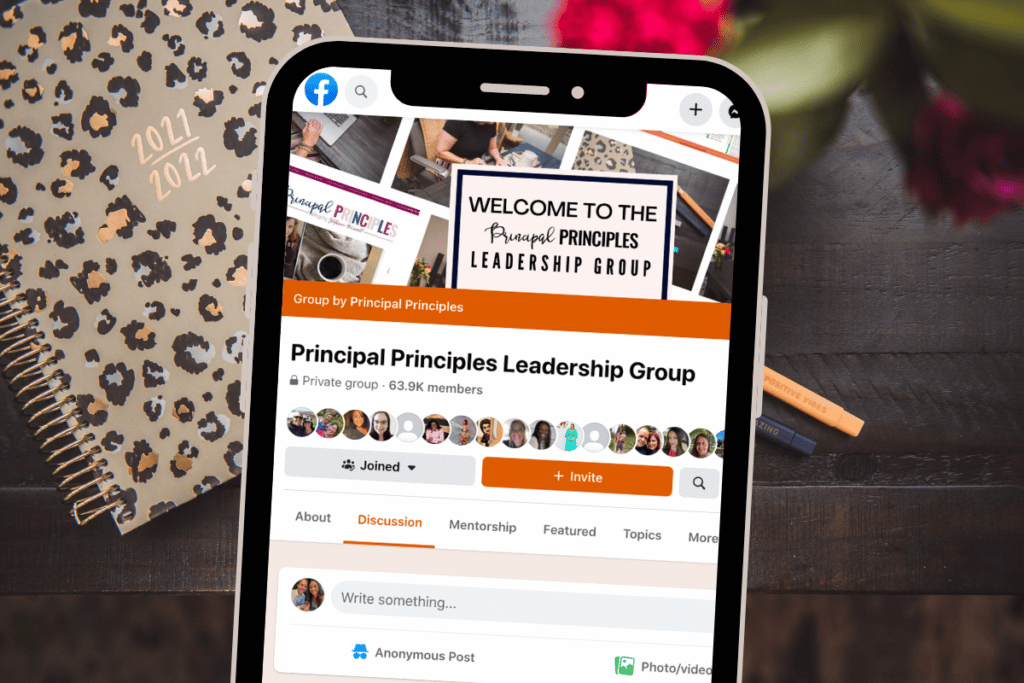
Join over 63,000 leaders in our Facebook group! Principal Principles Leadership is a professional learning network for future and current school leaders. We share ideas and resources every day!
A description of what the benefit is of joining your list. Updates, sale notifications, resources?

