

As a school principal or lead administrator, performance reviews are an essential tool for assessing the effectiveness of the school’s educational programs, identifying areas for improvement, and making informed instructional decisions. In this blog post, I will discuss how to perform quarterly performance reviews using student data to make instructional decisions.
The first step in performing a performance review is to identify the Key Performance Indicators (KPIs) that will be used to assess student progress. KPIs should be aligned with the school’s academic goals and objectives and should be measurable, specific, and relevant to the subject being taught. Some examples of KPIs for math could be the percentage of students meeting or exceeding proficiency on standardized tests, the number of students completing math assignments on time, or the frequency of student engagement during math class. If you haven’t started using the Standard By Standard Tracker, check this document out.
Once KPIs have been identified, the next step is to collect and analyze data to evaluate student performance. Data can come from a variety of sources, including standardized test scores, teacher assessments, student surveys, and classroom observations. Analyzing data involves looking for patterns and trends in student performance, identifying areas of strength and weakness, and making comparisons between different groups of students.
School leaders should collaborate with teachers to discuss the data and its implications. Teachers are on the front lines of education and have a wealth of knowledge about their students’ strengths, weaknesses, and learning styles. By collaborating with teachers, school leaders can gain insights into how to tailor instruction to better meet the needs of their students.
Based on the data analysis and collaboration with teachers, school leaders can make informed instructional decisions to improve student performance. For example, if data shows that a significant number of students are struggling with fractions in math, the school could implement a new intervention program or provide additional professional development for teachers to improve their instruction in this area.
Performance reviews should be an ongoing process. After making instructional decisions, school leaders should continue to monitor student progress and evaluate the effectiveness of their interventions. This will allow for adjustments to be made as needed and ensure that the school is continuously improving its educational programs.
Here is an example of what the Excel format could look like:
| Math KPIs | Q1 | Q2 | Q3 | Q4 |
|---|---|---|---|---|
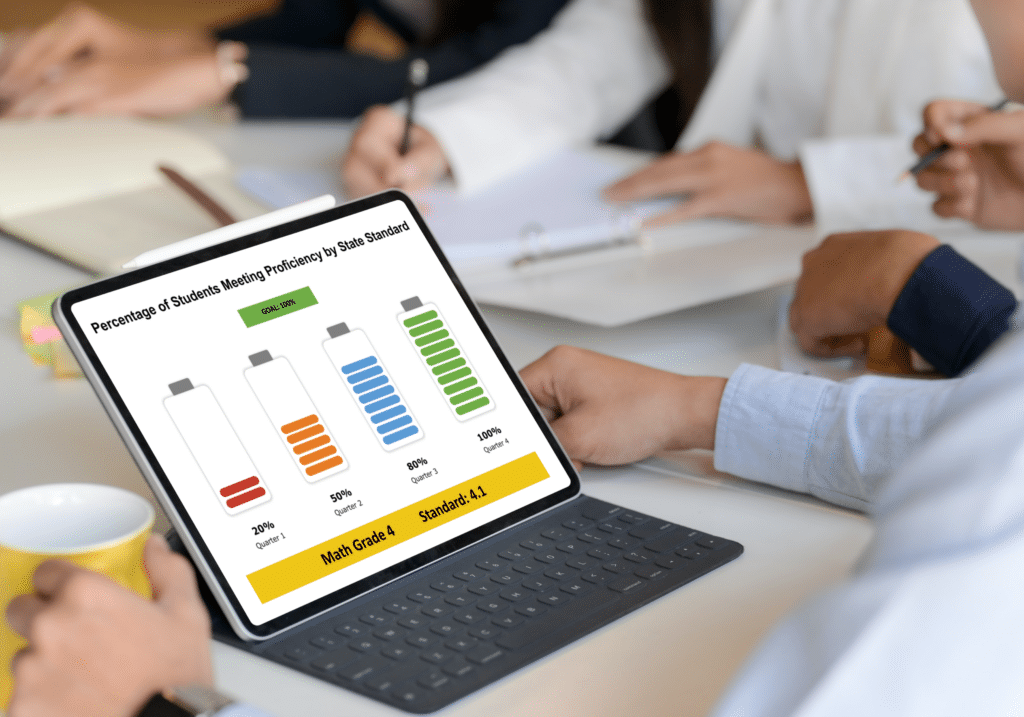
| Percentage of Students Meeting Proficiency by State Standard | 60% | 65% | 70% | 75% |
| Grade 3: State Standard: 3.1 | 60% | 70% | 70% | 75% |
| Number of Students Completing Assignments on Time | 80% | 85% | 90% | 95% |
| Math Fact Fluency – 3rd grade | GL 2.0 | GL 3.1 | GL 3.5 | GL 4.0 |
By using an Excel format to track KPIs, school leaders can easily monitor progress towards academic goals and make data-driven decisions to improve student performance.
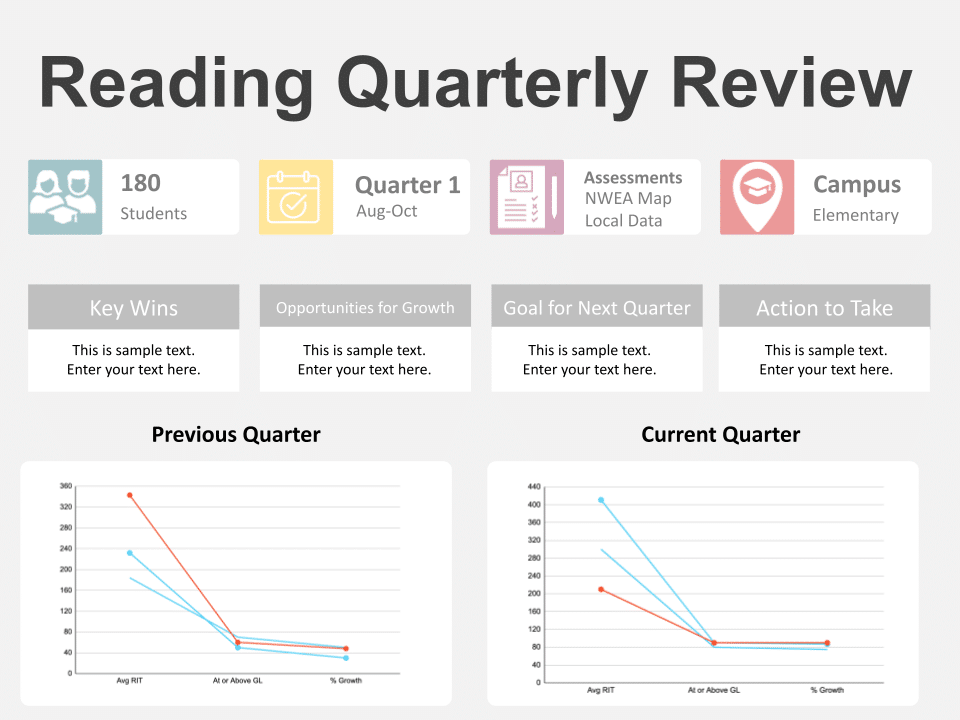
If you prefer a Powerpoint Dashboard, I have created that template as well. It connects to Excel, but it often gives a more “presentable” format to non-excel users.
In conclusion, performance reviews are a critical tool for school leaders to assess the effectiveness of educational programs, identify areas for improvement, and make informed instructional decisions. By using student data to evaluate performance, collaborating with teachers, and making ongoing adjustments to instruction, school leaders can ensure that their students receive the best possible education.

I’m Stephanie, and I’m the face behind Principal Principles. I’m a former principal turned educational consultant, presenter, and edupreneur. I’m obsessed with giving school leaders the tools they need to lead a successful school.

Hello friend! Welcome to Principal Principles. I’m Stephanie, and I’m the face behind Principal Principles. I’m a former principal turned educational consultant, presenter, and edupreneur. I’m obsessed with giving school leaders the tools they need to lead a successful school.

Join over 63,000 leaders in our Facebook group! Principal Principles Leadership is a professional learning network for future and current school leaders. We share ideas and resources every day!
A description of what the benefit is of joining your list. Updates, sale notifications, resources?